Almost all Linux administrators know default real time Linux system health monitoring using ‘top’ command.
But unfortunately, top command does not have good display and result.
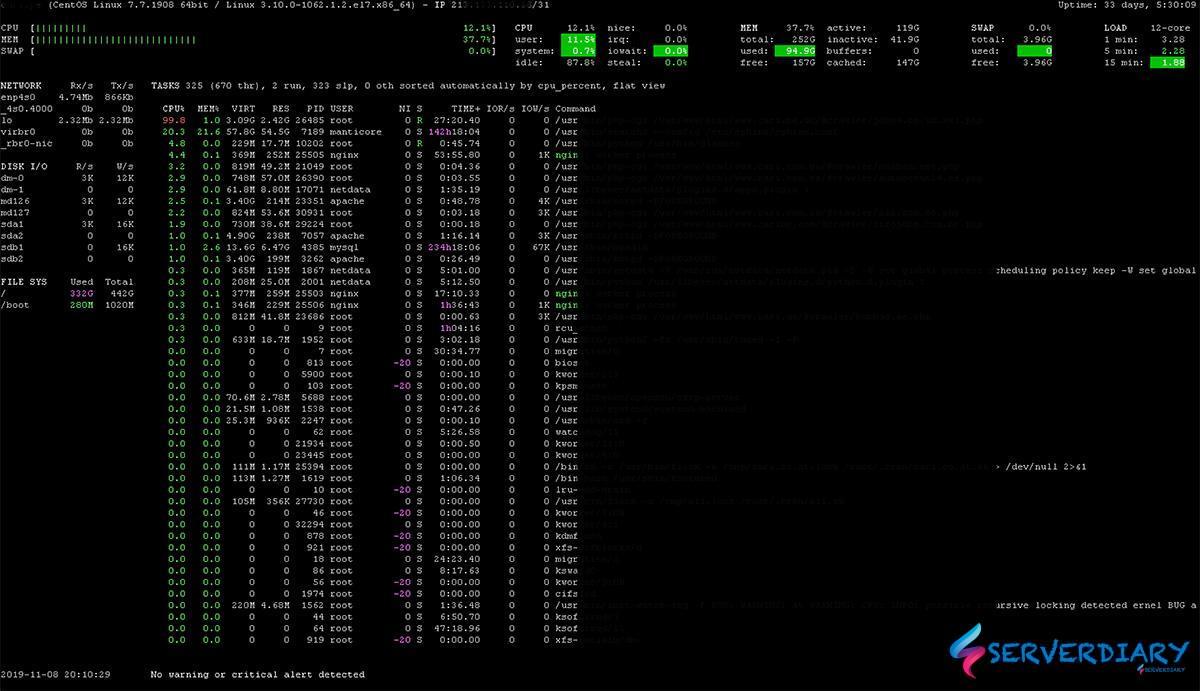
There is available tools, Glances with a slogan “An Eye on your system”.
Glances is a cross-platform system monitoring tool written in Python.
Also Read: How to install Netdata to monitor your linux system
Glances will run on almost any platform : GNU/Linux, FreeBSD, OS X and Windows.
You can use the built-in Web UI and monitor your system from any device.
Here are Glances features:
- CPU monitoring
- Memory monitoring
- Load monitoring
- Process list monitoring
- Network interface monitoring
- Disk I/O monitoring
- IRQ / Raid monitoring
- Sensors monitoring
- Filesystem (and folders) monitoring
- Docker monitoring
- Monitor monitoring
- Alert monitoring
- System info monitoring
- Uptime monitoring
- Quicklook (CPU, MEM, LOAD) monitoring
How to install Glances
Install Epel repository, update and install required dependencies
## Centos / RHEL 6 / 7
# yum install epel-release
# yum update
# yum install libpcap libpcap-devel ncurses ncurses-devel
# yum install glances

## Centos / RHEL 8 / Fedora 22
# dnf install glances

## Ubuntu / Debian
# sudo apt-get update
# sudo apt-get install glances
How to use Glances
To use Glances, open terminal and run command:
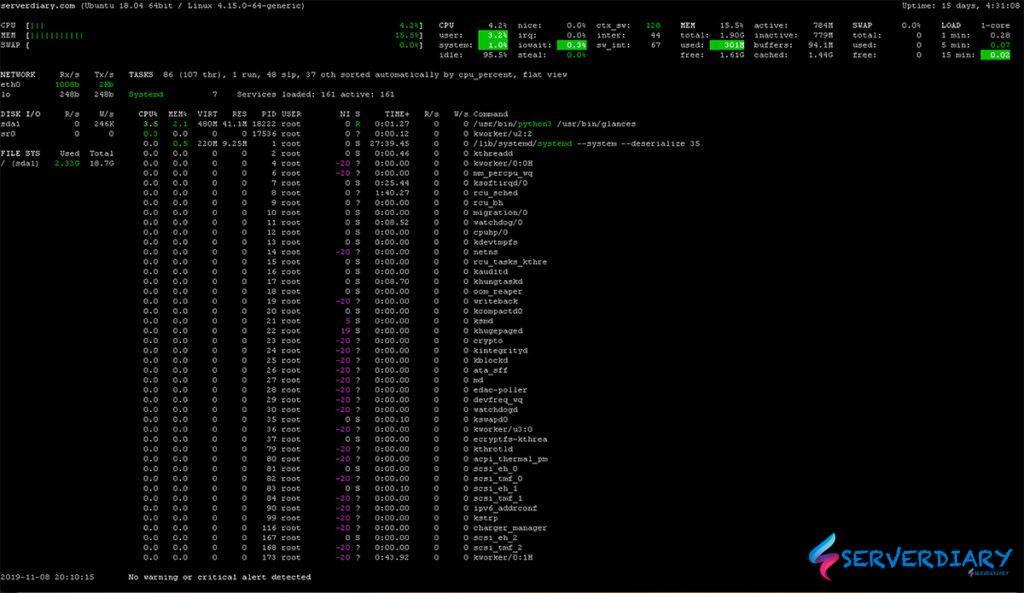
# glancesDefault refresh interval is 1 second. You can set custom refresh interval.
# glances -t 5Below is example glances usage on Ubuntu
Use Glances on Remote monitoring
Monitor system on Glances server from another system as client.
# glances -s
Glances server is running on 0.0.0.0:61209
From client system, run command below:
# glances -c serverdiary.comYou can specify port with -P option.
